
Why is access to 5 years of AMC purchase data so significant?
AMC has transformed how brands analyze and activate against consumer behavior, from connecting behavioral and purchase data to building high-intent audiences. But until now, advertisers could only access 12.5 months of purchase data—far too short to capture real loyalty, repeat purchasing, or the true definition of “new-to-brand” (NTB) shoppers. Five years of data gives a more complete picture, especially as ecommerce adoption accelerated in 2020 and beyond.
What we’ve uncovered so far
With this longer lookback, Flywheel can now accurately distinguish true NTB shoppers from lapsed buyers, helping brands retarget the right audiences and optimize acquisition costs. Brands can also track real loyalty, calculate long-term value with greater precision, and identify which shoppers drive sustainable growth. Combining these insights with AMC Audiences allows for more personalized messaging and a deeper understanding of the consumer journey.
Introducing: Flywheel’s CLTV dashboard
Flywheel’s new AMC Consumer Long-Term Value (CLTV) Dashboard offers a suite of reports designed to give your brand a more strategic view of your consumer journeys, loyalty, and cross-category purchasing trends. Each report focuses on a specific aspect of consumer behavior, offering actionable insights through detailed data visualizations and metrics that uncover critical opportunities for business growth. Let’s dive into them in more detail.
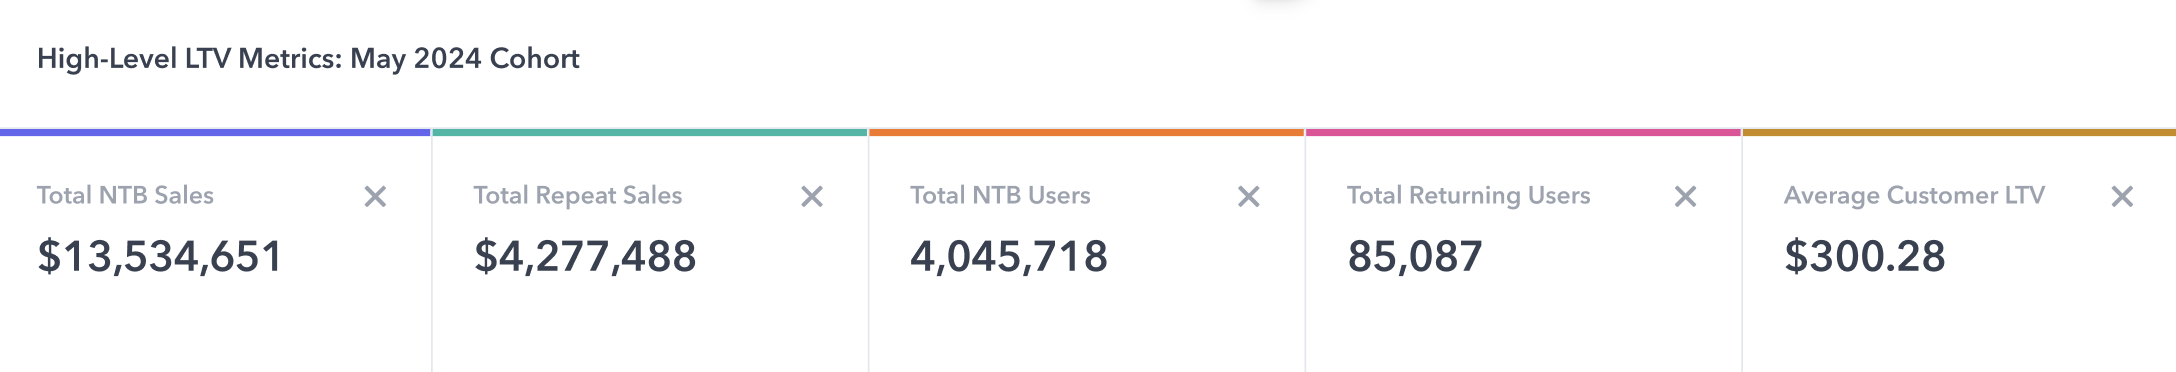
The High-Level Account Overview provides a summary of key metrics related to customer acquisition, retention, and lifetime value. Metrics like Total NTB (New-to-Brand) Sales, Total Returning Sales, and Average Consumer LTV give brands a clear understanding of how effectively they are acquiring and retaining customers over time. This report uncovers the overall effectiveness of your acquisition and retention efforts, providing a stable benchmark for evaluating consumer value and campaign performance, helping you monitor trends and adapt your strategies for long-term success.
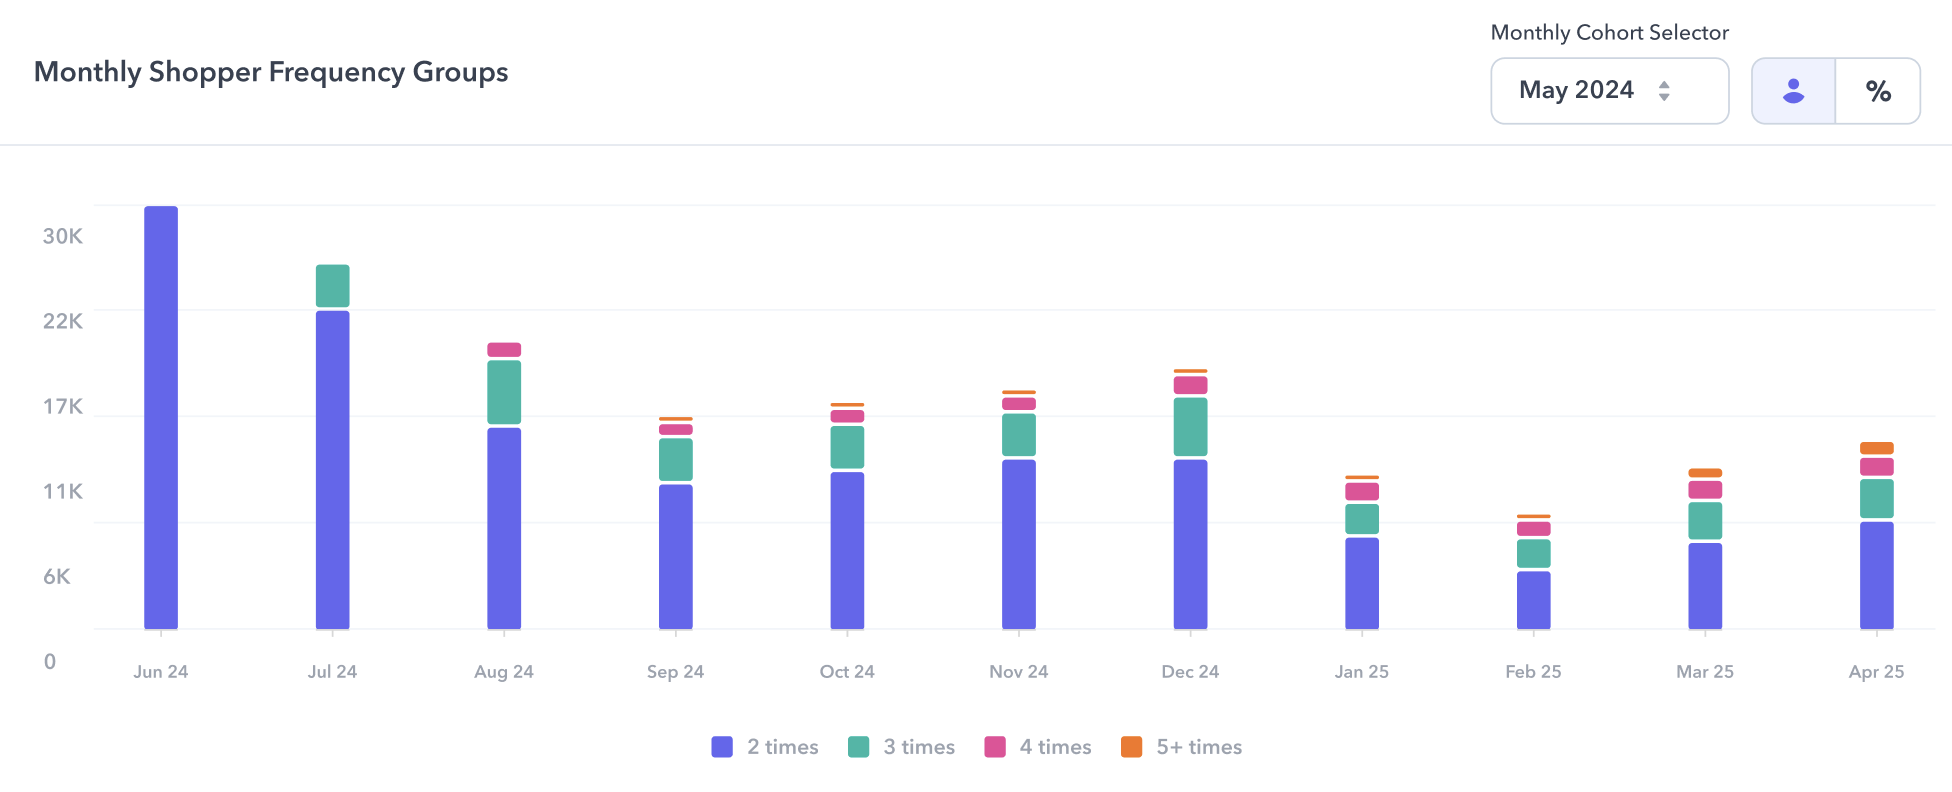
The Monthly Shopper Frequency Groups report delves into how often shoppers from a specific monthly cohort return to the brand over time. By analyzing purchase frequency on a monthly basis, advertisers can identify patterns or trends in customer loyalty and engagement.
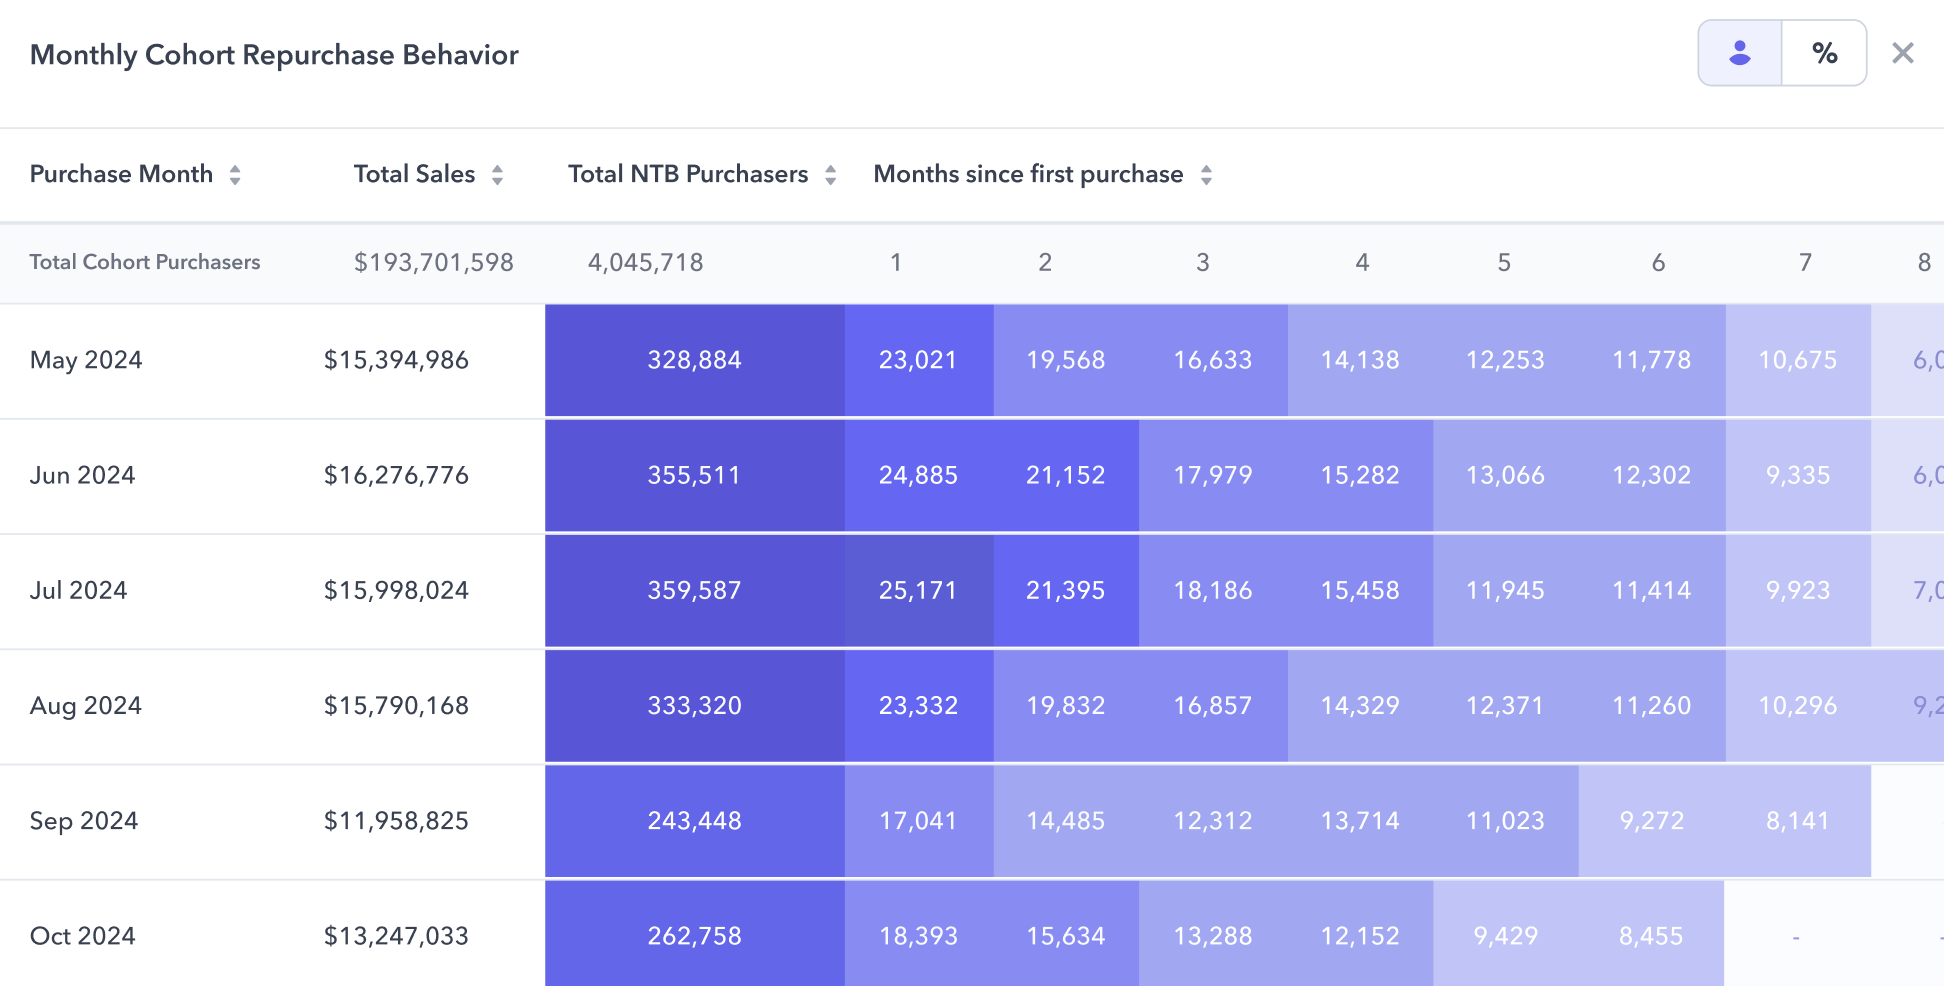
Similarly, the Monthly Cohort Repurchase Behavior report focuses on tracking the repurchase rates of NTB consumers across different cohorts. It highlights how many first-time buyers return for subsequent purchases, providing valuable insights into retention rates - helping you see how effectively you are in acquiring and turning first-time buyers into loyal, repeat purchasers.
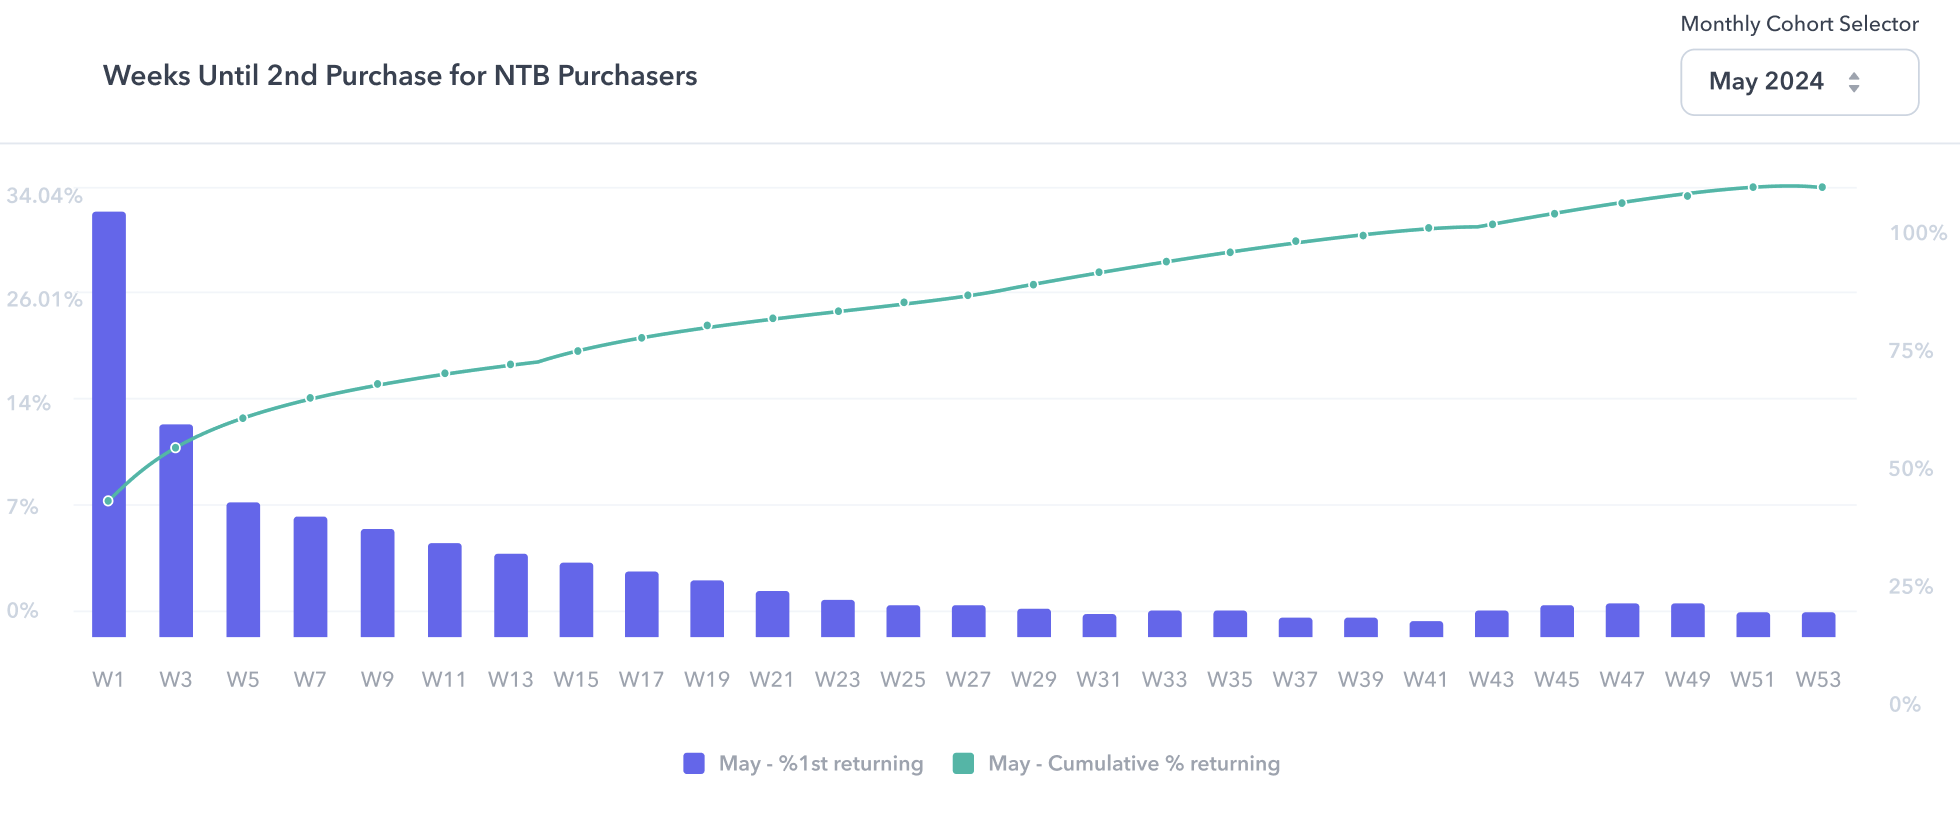
For brands looking to optimize retention strategies, the Weeks Until Second Purchase report is a powerful tool. This report tracks the time it takes for NTB consumers to make their second purchase, helping advertisers understand the typical repurchase timing for their customer base. In this understanding, you can then fine-tune retention campaigns and re-engagement strategies to align with actual behavior and maximize your long-term customer loyalty.
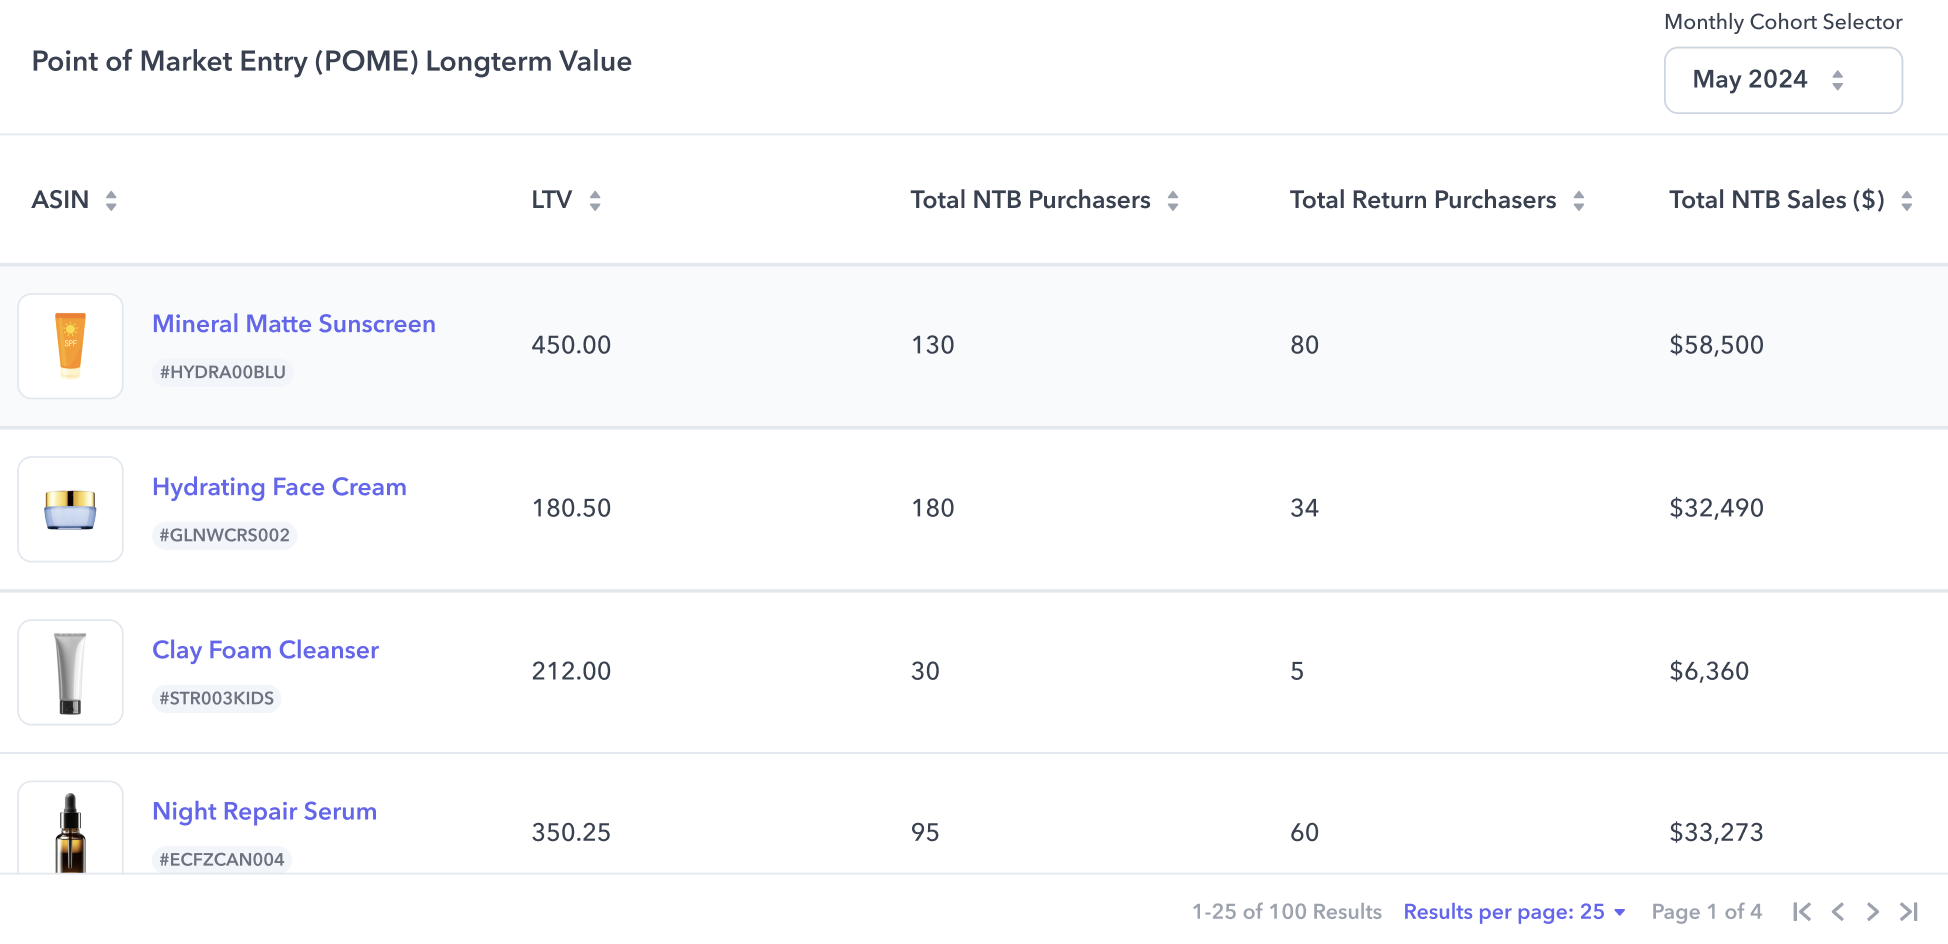
The Point of Market Entry (POME) Long-Term Value report focuses on understanding how shoppers evolve after their initial purchase. This report uncovers how they progress through your product catalog after their initial purchase, helping you identify natural category transitions and bundling opportunities to increase overall sales.
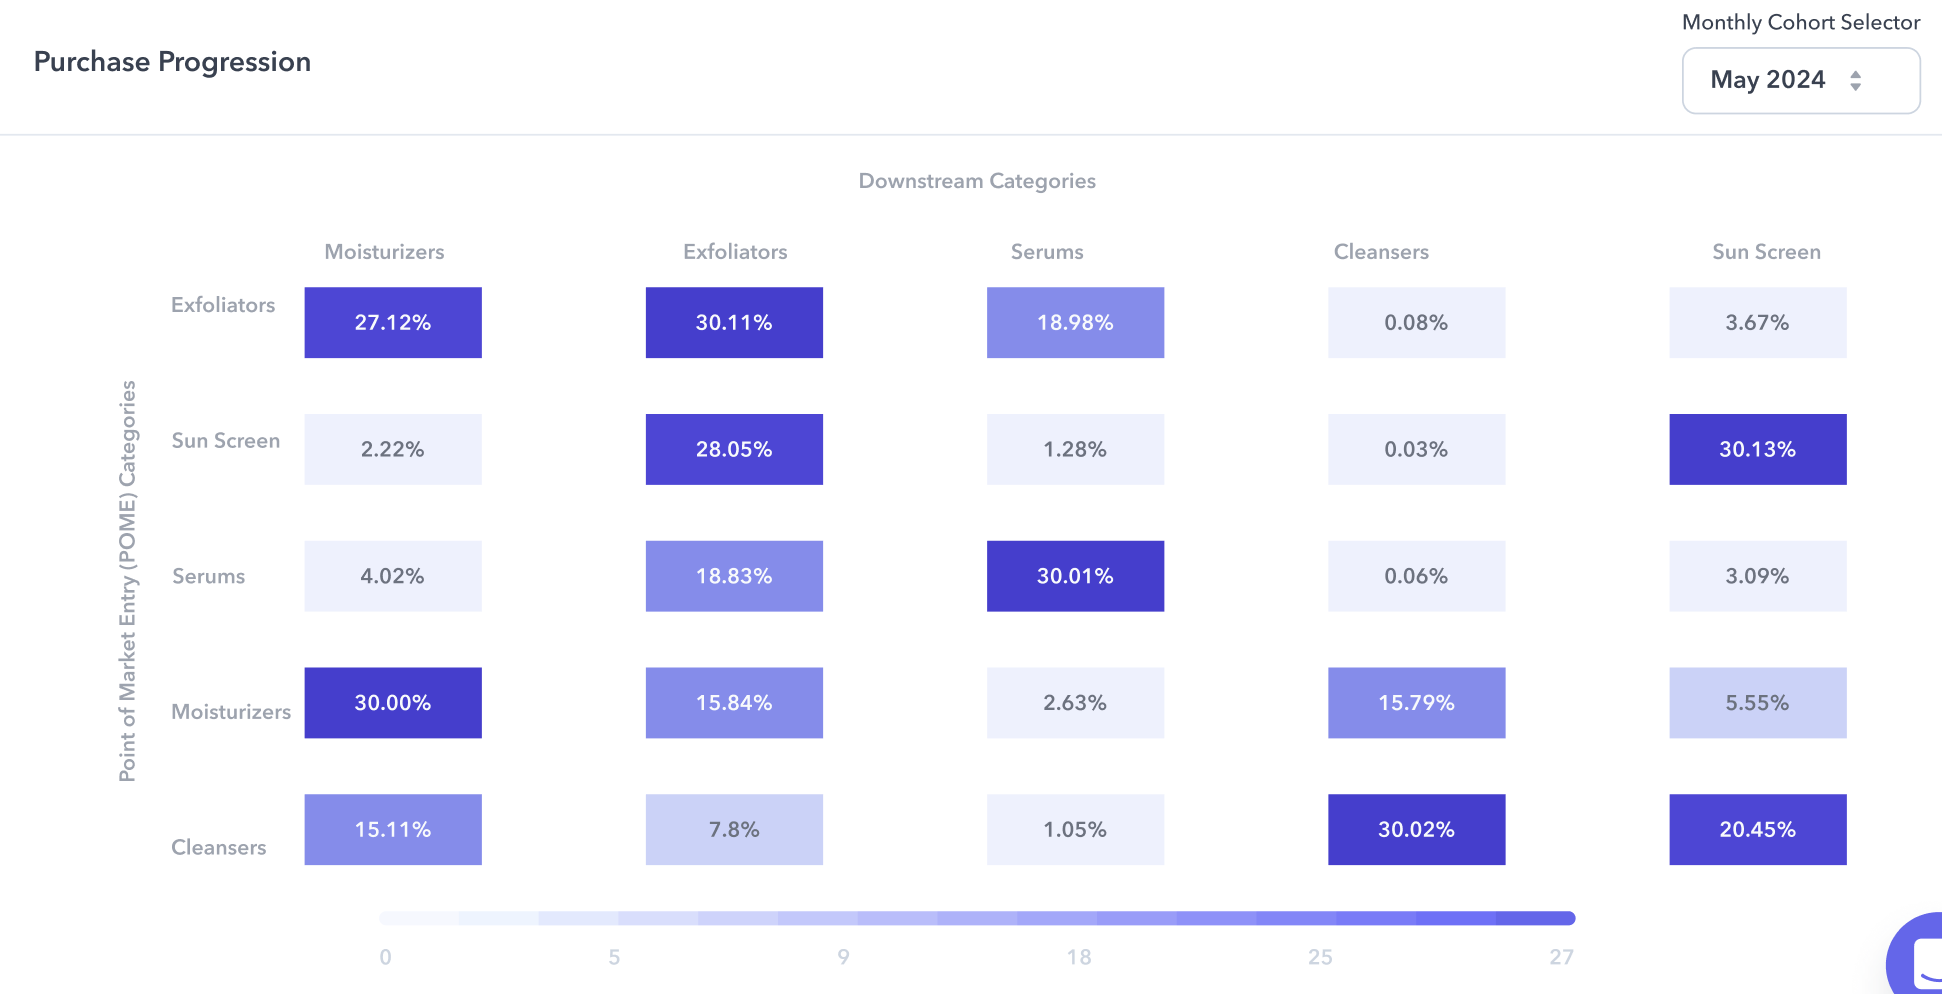
Last but not least, the Cross Purchase Progression Report tracks how consumers expand their relationship with your brand after their POME. By analyzing which categories shoppers return to over time, it reveals patterns in cross-category purchase behavior. These insights help identify prime opportunities for basket building, upselling, and developing more effective product journey strategies.
Together, these reports offer a comprehensive view of consumer behavior over a longer period, enabling advertisers to identify high-value patterns, validate long-term strategies, and capitalize on opportunities for growth. By seamlessly integrating these insights into your business strategy, you can optimize campaigns, product offerings, and retention initiatives, ensuring sustained growth and a competitive edge in the retail media landscape.
Questions that are unlocked with the CLTV dashboard
With a thorough understanding of the value of 5 years-worth of data and the various dashboards that Flywheel has built, now it's time to see how these dashboards can help answer your pressing business questions and set the stage for achieving your brand’s goals.
Am I prioritizing the right Point of Market Entry (POME) ASIN(s)?
In the POME Long-Term Value Report, you can sort by highest Total NTB Purchasers, and this will show which ASINs are most effective at introducing new shoppers to your brand.
Looking at the LTV of these high NTB ASINs provides insight into if the product(s) bringing in the most NTB purchasers are also driving loyalty/long-term value.
Best case scenario: If your top NTB ASINs have high LTV, your current strategy is effective and you’re prioritizing the right POME ASINs.
If your top NTB ASINs lack high LTV, consider deprioritizing or enhancing them through cross-selling or bundling strategies.
If not, what are better POME ASINs to consider?
Within the POME Long-Term Value Report, sort your ASINs by highest LTV. Look for ASINs that have strong LTV but lack NTB Purchases, consider allocating more resources to promote these high-LTV ASINs through targeted ad campaigns to attract new customers.
By following this analysis, you can ensure your POME strategy effectively drives both new customer acquisition and long-term value.
Are NTB purchasers during heavy deal periods (e.g. BFCM, Prime Day) as valuable as those who buy me during periods of fewer deals? Or are those shoppers just deal seekers?
In the Monthly Cohort Repurchase Behavior Report, you can:
Identify Deal Period Cohorts: Look for cohorts aligned with heavy deal periods, such as Black Friday/Cyber Monday (BFCM) and Prime Day.
Compare with Non-Deal Periods: Use the heat map (darker vs. lighter purple) to quickly assess repurchase behavior of deal vs non-deal periods. Darker shades indicate higher repeat purchases.
Darker Shades in Deal Periods: Suggests that customers acquired during deals are returning frequently, indicating potential long-term engagement.
Lighter Shades in Deal Periods: Indicates fewer repeat purchases, suggesting these customers might be primarily motivated by discounts.
Looking at number of repurchases isn’t always enough. It’s also valuable to look at what ASINs they’re buying. In the POME Long-Term Value Report:
Use the cohort filter to analyze deal periods and sort by highest NTB Purchases. This tells you which ASIN brought in the most NTB Purchases during the deal period.
Compare the LTV of that same ASIN purchased during a non-deal period:
LTV is Lower During Deal Periods: This suggests that customers may be primarily deal seekers, with less long-term loyalty.
LTV is Higher During Deal Periods: Indicates that deal period customers are valuable and could potentially be converted into loyal customers.
What categories should I target next to maximize cross-sell opportunities?
Using the Purchase Progression Report, you can:
Identify Initial Purchase Categories:
Look at the POME categories to see where customers are entering your brand.
Analyze Downstream Categories:
Observe which categories customers move to after their initial purchase. Darker shades indicate higher transitions.
Target Cross-Selling:
Develop targeted cross-sell campaigns for the identified downstream categories.
Bundle Opportunities:
Create product bundles that include both the POME ASIN and popular downstream categories to increase average order value.
Ready to turn consumer insights into long-term growth?
Flywheel’s CLTV dashboard unlocks the full potential of AMC’s five-year purchase data—making it easier than ever to identify high-value shoppers, optimize your Point of Market Entry strategy, and maximize retention. If you’re ready to see the bigger picture and make smarter, data-driven decisions for your brand, get in touch with our team to schedule a personalized walkthrough.
Let’s shape the future of commerce together.

Ready to grow your business?
Let's discuss the best approach to meet your brand's specific needs.
Let's connect